2026 At a Glance
Plus: 1,130 active website users · 1,133 new users · 7,654 tracked website events
Placer.ai measured the defined Downtown Mount Clemens market using an Inbound Visitor audience filter from 10 AM–11 PM. These figures describe downtown visitation/activity, not direct festival attendance. Website analytics cover Jun. 3–Aug. 31, 2026.
A Festival Built Into the City
MCEMF's defining feature was its relationship with downtown Mount Clemens. The festival did not ask people to enter a closed event footprint. It placed electronic music inside the existing downtown environment.
That created multiple ways to participate. A dedicated electronic-music fan could arrive for the lineup. A family could encounter the event while exploring downtown. A visitor could move between stages, businesses, and public spaces. The city itself became part of the experience.
Measurable Downtown Activity
Placer.ai's report for August 22 measured the defined Downtown Mount Clemens market with an Inbound Visitor audience filter from 10 AM to 11 PM.
The report recorded approximately 6,300 visits, representing a 51.5% year-over-year increase compared with August 22 one year earlier. Average daily time spent in the market was 119 minutes, with a median of 79 minutes.
A separate hourly activity report shows average downtown population building through the afternoon and evening and reaching approximately 2,000 around the 9 PM peak.
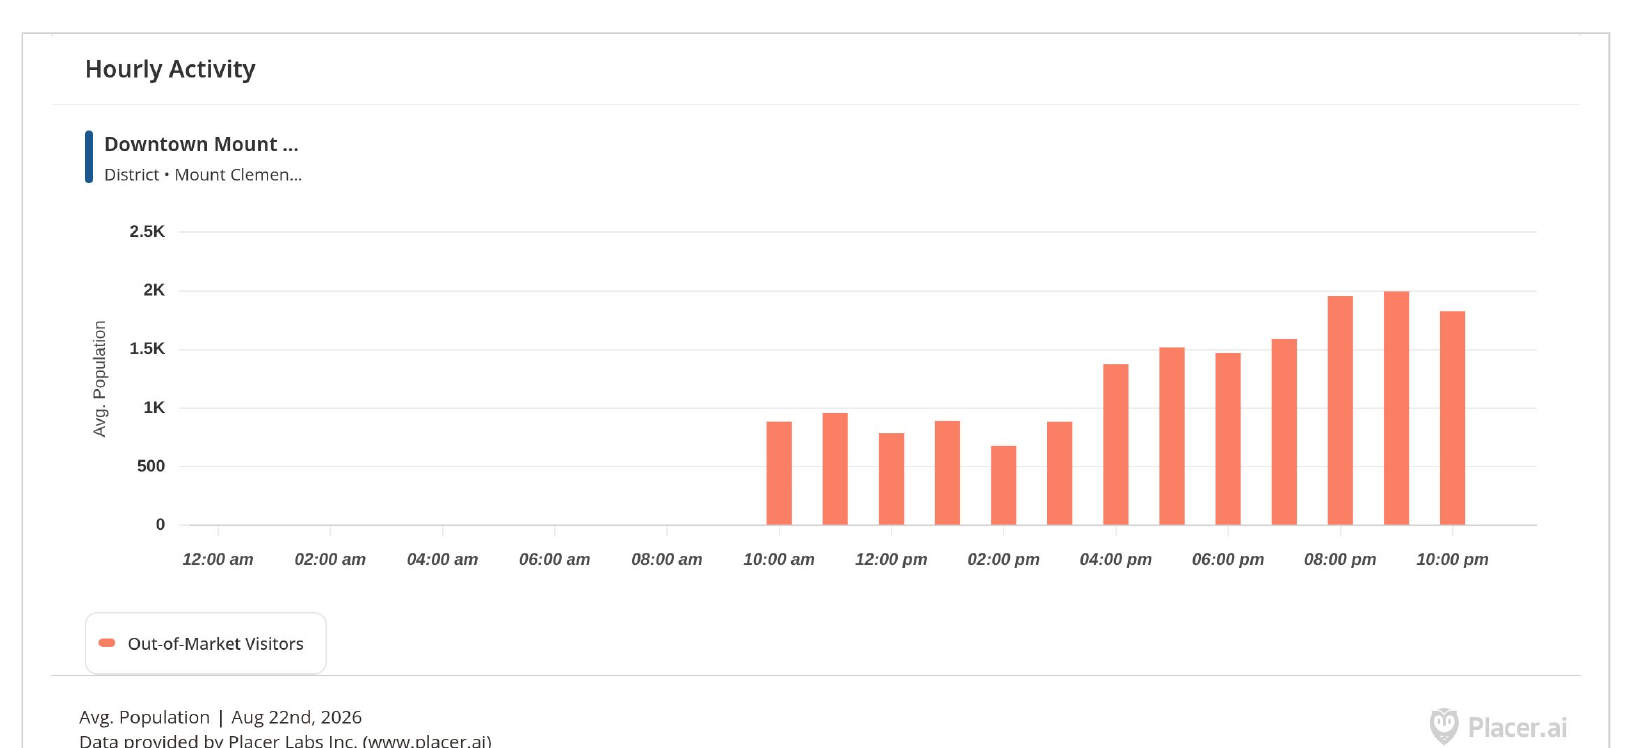
Because MCEMF was free, ungated, and embedded in an active downtown district, these measurements should not be interpreted as a direct festival attendance count. They are evidence of the level and duration of activity within the downtown market on festival day.
Visitors Moved Through Downtown
The Placer.ai report also identified downtown destinations visited by people in the measured market, led by Three Blind Mice Irish Pub.
| Rank | Name | City | Visitors |
|---|---|---|---|
| 1 | Three Blind Mice Irish Pub | Mt Clemens, MI | 258 (4.09%) |
| 2 | BP | Mount Clemens, MI | 149 (2.36%) |
| 3 | Fifth Third Bank & ATM | Mount Clemens, MI | 109 (1.73%) |
| 4 | The TinyTree Gallery | Mt Clemens, MI | 27 (0.43%) |
| 5 | Huntington Bank | Mt Clemens, MI | 14 (0.22%) |
| 6 | SVS Vision | Mount Clemens, MI | 14 (0.22%) |
This does not establish how much festival visitors spent or prove that MCEMF caused any individual business visit. It does demonstrate that the measured audience was occupying and moving through a functioning downtown district rather than remaining inside an isolated event venue.
Regional Draw
The measured visitor base extended beyond Mount Clemens. ZIP code 48043 accounted for approximately 1,100 visits, or 17.7% of measured visits. Other leading origins included Clinton Township, Harrison Township, Macomb, New Baltimore, Roseville, and Sterling Heights.
Leading ZIP Codes
| Origin | Visits | Share |
|---|---|---|
| 48043 · Mount Clemens | 1.1K | 17.7% |
| 48036 · Clinton Twp. | 544 | 8.6% |
| 48045 · Harrison Twp. | 529 | 8.4% |
| 48038 · Clinton Twp. | 492 | 7.8% |
| 48035 · Clinton Twp. | 358 | 5.7% |
| 48044 · Macomb | 270 | 4.3% |
| 48047 · New Baltimore | 232 | 3.7% |
By County
| County | Visits | Share |
|---|---|---|
| Macomb, MI | 5,062 | 80.3% |
| Oakland, MI | 405 | 6.4% |
| St. Clair, MI | 298 | 4.7% |
| Wayne, MI | 213 | 3.4% |
| Livingston, MI | 48 | 0.8% |
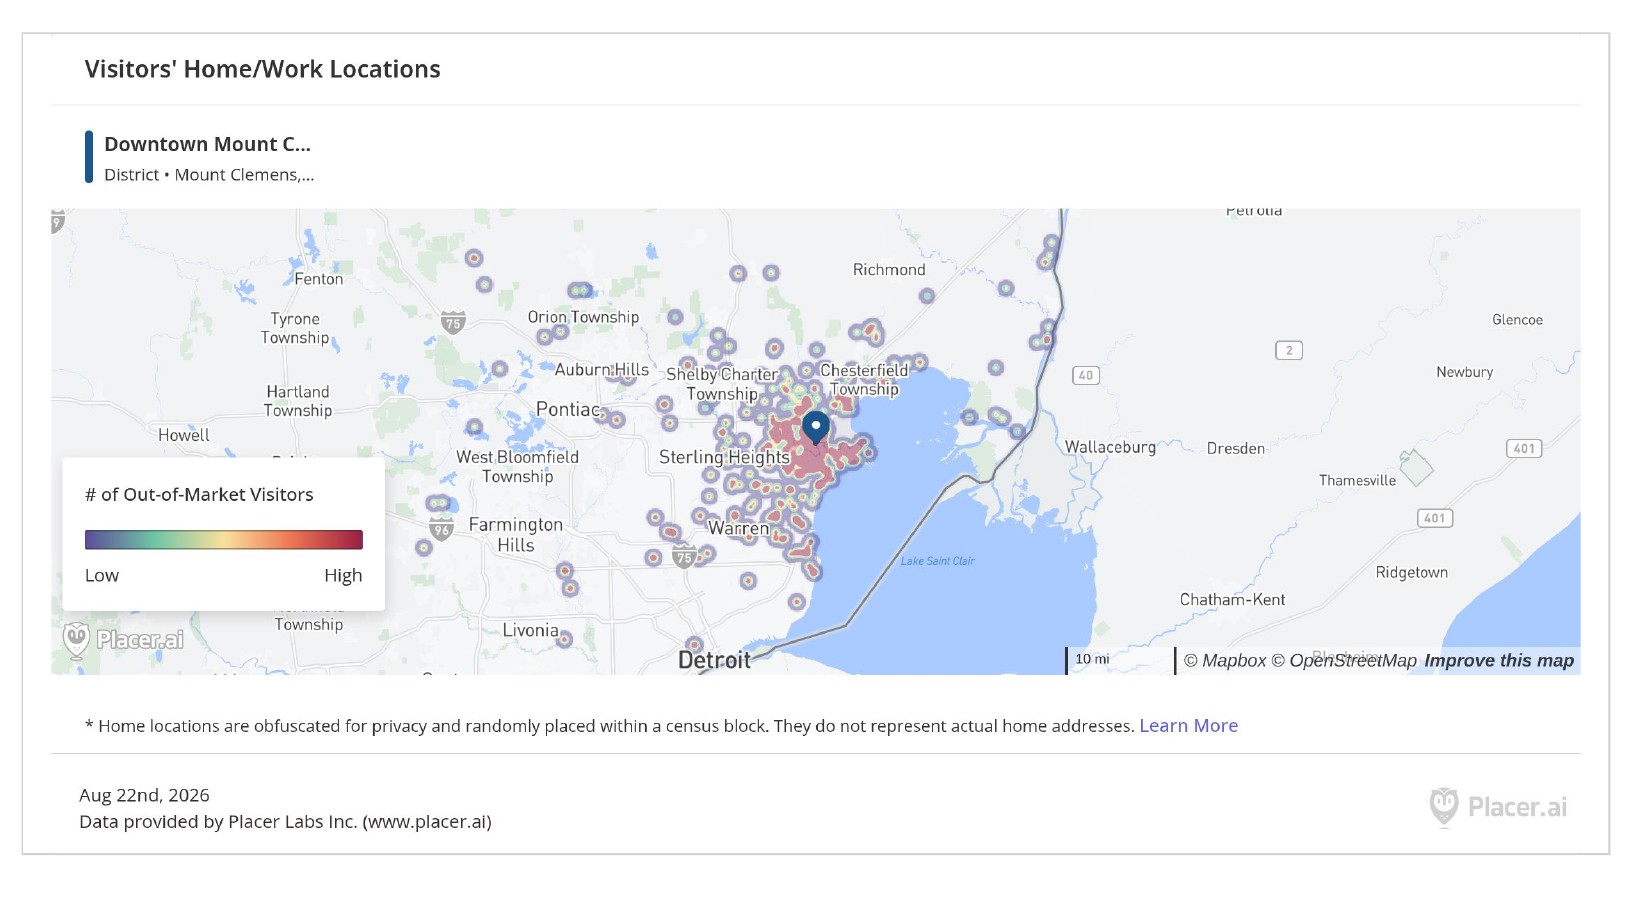
The report's home/work-location visualization shows a broader concentration across Metro Detroit and Southeast Michigan, giving potential partners a clearer picture of MCEMF as a regional event rooted in Mount Clemens rather than an experience limited to one ZIP code.
A Sponsor-Relevant Audience Snapshot
Placer.ai's demographic profile for Downtown Mount Clemens Inbound Visitors provides an additional view of the measured audience, compared with Michigan benchmarks using STI Popstats data.
For context, Michigan overall: $77.9K median household income, 31.9% bachelor's degree or higher, 2.44 persons per household, 72.9% White. Demographic data should be interpreted as an audience profile of the measured downtown market, not as a direct census of festival attendees.
Digital Discovery Before Festival Day
MCEMF's audience relationship began before anyone arrived downtown. Google Analytics for June 3 through August 31 recorded 1,130 active users, 1,133 new users, 891 engaged sessions, a 50.8% engagement rate, and 7,654 tracked events on mcemf.com. The homepage drew 1,800 views, and the Artists page — lineup, set times, and full bios — drew 777 views on its own.
The geographic report contained 231 city rows. Detroit was the largest identified city by active users at 165 (14.6%), followed by Indianapolis at 150 (13.3%); Mount Clemens recorded 98 active users (8.7%), with additional identified audiences in Sterling Heights (57), Fraser (33), St. Clair Shores (28), Grand Rapids (23), Atlanta (22), and Macomb (19).
These are website-user locations, not physical visitor origins. Their value is different: they show that MCEMF's digital discovery footprint extended well beyond the immediate host city.
Electronic Music Without the Velvet Rope
MCEMF was designed as a free, community-facing event. Electronic-music enthusiasts shared the experience with families, children, downtown visitors, and people who may not ordinarily enter a club or ticketed electronic-music event.
For partners, that creates a different kind of cultural platform: one rooted in music credibility but exposed to a broader public through the fabric of the city.
Three Stages. One Downtown.
Approximately 20 performers appeared across three stages: Main, Corridor, and the Discovery Center programming area. Each environment created a different point of contact while remaining part of one festival experience. See the full 2026 lineup and artist bios.
The first year also revealed clear opportunities for 2027: stronger professional production, improved staging and sound, clearer wayfinding, a more developed third-stage environment, and a denser immersive treatment of the Corridor.
Partnership Can Be More Than Logo Placement
MCEMF's physical and community structure creates room for partnerships that contribute something audiences can actually experience. The goal for 2027 is not to cover the festival in sponsor marks. It is to identify places where partner investment can make the event materially better.
Potential partnership areas include stage experiences, artist programming, family experiences, immersive environmental installations, hospitality, community programming, digital storytelling, production infrastructure, emerging-artist support, accessibility, sustainability, and downtown experiences.
LET'S BUILD SOMETHING PEOPLE REMEMBER.
What Sponsor Investment Can Unlock
Why Mount Clemens?
Mount Clemens offers something difficult to manufacture inside a conventional festival site: a compact downtown with businesses, public space, walkability, and existing community activity already surrounding the event.
Year-one data provides an initial evidence base for that proposition. The measured market drew visitors from across the surrounding region, recorded nearly two hours of average daily time in market, and showed substantially higher visitation than the same date one year earlier.
The opportunity is not simply to grow a music event. It is to build an annual cultural experience that gives artists, audiences, downtown businesses, community partners, and sponsors a reason to converge in Mount Clemens.
Interested in Partnering for 2027?
Year one proved the concept. Let's build year two deliberately — together.
Sponsorship contact information coming soon.